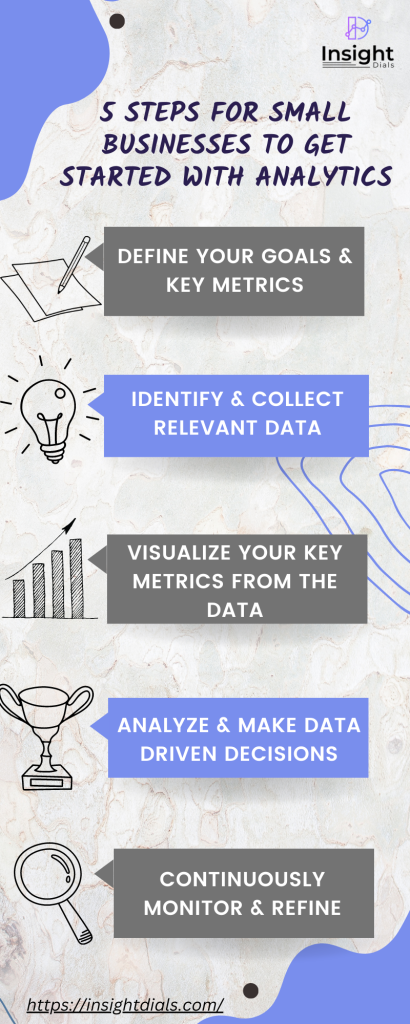
Business analytics refers to the practice of utilizing data and statistical methods to gain insights, make informed decisions, and drive business performance. It involves collecting, analyzing, and interpreting data from various sources to uncover patterns, trends, and correlations that can be used to improve organizational efficiency, solve complex problems, and identify opportunities for growth. Read on how to get started with business analytics.
Why is Business Analytics important?
Simply because Numbers don’t lie.☺
It’s like having a trusted advisor who guides your decision-making process with cold, hard facts. They give a reflection of reality, offering a clear and quantifiable representation of various aspects of an organization’s operations, goals, and achievements. This helps organizations track progress, identify gaps, and make adjustments to ensure they are on track to achieve their objectives.
With the help of advanced analytics tools and technologies, organizations can real-time monitor and track their metrics on demand. This means stakeholders have immediate access to the latest data and performance indicators. Stakeholders can easily share and discuss metrics with colleagues, regardless of their location or time constraints. This fosters a culture of collaboration, as teams can engage in productive discussions based on real-time data, align their efforts, and collectively work towards common goals.
By regular monitoring and analysis, organizations can gain valuable insights into their strengths, weaknesses, and areas for improvement. Real-time access to metrics enhances agility and responsiveness within organizations. It enables teams to identify emerging trends, detect anomalies, and promptly address issues or capitalize on opportunities. For instance, if a sudden drop in website traffic is observed through real-time analytics, immediate actions can be taken to investigate and rectify the issue before it significantly impacts customer experience or conversions.
How to get Started with Business Analytics

STEP 1: Be clear on what you want to measure :
Before diving into the world of analytics, it’s crucial to have a clear understanding of your objectives. Ask yourself what you want to achieve through data analysis. Are you looking to enhance business performance, optimize marketing campaigns, improve customer experience, or solve a specific problem? Clearly defining your objectives will guide your analytics journey and help you focus on the right data and metrics.
While metrics are valuable in providing insights and guiding decision-making, it is important not to go overboard and measure everything. Having a multitude of metrics can lead to information overload and dilute the focus on what truly matters. Instead, it is crucial to have a well-defined set of key metrics that align with the organization’s objectives and strategic priorities. These key metrics, often referred to as key performance indicators (KPIs), should be carefully selected and agreed upon through thoughtful discussions with the team. Here’s a step-by-step approach to help you define goals and choose appropriate key metrics:
1. Understand the Organizational Strategy: Start by gaining a deep understanding of your organization’s overall strategy. Define the core objectives, mission, and vision. This will provide a foundation for aligning your goals and metrics with the broader organizational direction.
2. Set SMART Goals: Establish SMART goals for each priority area. For example, a SMART goal could be to increase revenue by 10% within the next fiscal year; or to improve customer satisfaction scores by 15% within six months. SMART goals provide clarity and a clear target for performance measurement.
3. Determine Key Metrics: Once you have set your SMART goals, identify the key metrics that will help track progress and measure success towards those goals.
STEP 2: Collate data that’s relevant
To begin your analytics journey, you need access to relevant data. Start by identifying the sources of data available to you. This may include your application databases, customer databases, transaction records, website analytics, social media platforms etc. Ensure that the data collected aligns with your defined objectives. Quality and accuracy of data are critical factors, so invest time in validating and cleaning your data to ensure its reliability.
1. Identify Data Sources: Identify the sources of data that contain the required information. This may involve accessing data from various systems, databases, or external providers. It’s important to consider the quality, reliability, and accessibility of the data sources.
2. Data Integration: In many cases, data needed for analytics initiatives may be spread across different systems or sources. To gain a comprehensive view and perform meaningful analysis, data integration may be necessary. This involves combining data from multiple sources into a centralized repository.
3. Data Governance: Establish data governance practices to ensure the quality, integrity, and security of the collected data. Define data ownership, data stewardship roles, and data management processes to maintain data quality and enforce data-related policies. Implement data governance frameworks to ensure consistent data definitions, data standards, and data documentation.
4. Continuously Update and Expand Data Sources: Data requirements may evolve over time as business needs change or new analytics opportunities arise. Continuously evaluate and update your data collection processes to ensure they align with evolving objectives. Explore new data sources and technologies to expand your data collection capabilities and stay ahead of the curve.
STEP 3: Visualize Data
There are numerous analytics tools available, ranging from simple spreadsheet applications to complex software suites. Choose a tool that matches your skill level and aligns with your objectives. These tools offer a wide range of functionalities, from basic data manipulation to advanced statistical analysis and data visualization. Some tools fully automate your data analysis process, as well as collate your data from multiple data sources.
Choose the right tool that makes data analysis easier for you, as it can greatly enhance the effectiveness and impact of your data analysis process. Here are some steps to help you choose the right visualization tool:
1. Understand Your Requirements: Start by understanding your specific requirements. The type of data you’ll be working with, the complexity of the analysis you need to perform, the desired level of interactivity, and the intended users for the visualizations.
2. Assess Visualization Capabilities: Look for tools that provide a wide range of visualization types, including bar charts, line graphs, pie charts, and more. Consider whether the tool supports advanced features like drill-down, filtering, sorting, and providing insights.
3. Consider Ease of Use: Choose a tool that aligns with your team’s skill level and technical capabilities. Consider the tool’s user interface, ease of data import, and intuitive features that allow users to adapt without extensive programming or design skills. Look for pre-built templates that saves time and are less complex.
4. Integration and Compatibility: Evaluate how well the visualization tool integrates with your existing data sources. Determine if the tool can easily connect to your data storage systems.
5. Cost Considerations: Finally, consider the cost of the visualization tool and the value it provides. Assess whether the tool’s pricing aligns with your budget and the potential return on investment it can deliver.
STEP 4: Analyse and take data-driven decisions
Visualizations are powerful tools for analyzing data and making data-driven decisions. They aid to support analysis and decision-making, but they should not be the sole basis for decisions. Use critical thinking, domain knowledge, and additional data sources to complement the insights derived from visualizations. Data-driven decisions are most effective when they combine the power of visualizations with a holistic understanding of the broader context and business considerations. Here are some key steps to effectively analyze visualizations and derive insights:
1. Examine Patterns and Trends: Analyze the visual elements of the visualization, such as bars, lines, or data points, to identify patterns, trends, and anomalies. Look for any significant variations, relationships, or correlations that may emerge.
2. Drill-Down and Interact: Take advantage of interactive features if available. Drill-down into specific data points or subsets of the visualization to explore further details and uncover more granular insights. Adjust date filters, or sort to analyze the data from different perspectives and uncover hidden patterns or relationships.
3. Consider Contextual Factors: Look beyond the visualization itself and consider relevant contextual factors that may influence the insights. Take into account external events, market conditions, or other variables that might impact the interpretation of the data. This helps ensure that decisions are based on a comprehensive understanding of the situation.
4. Make Informed Decisions: Once you have analyzed the visualization and derived insights, use the findings to inform your decision-making process. Consider the implications of the insights and how they align with your goals or objectives. Identify actionable steps or strategies based on the analysis to drive positive outcomes.
STEP 5: Continuous Monitoring & Refining
Use visualizations as a tool for ongoing monitoring, performance measurement, and iterative decision-making. Analytical tools also helps to have round the clock access to metrics, which empowers organizations with real-time insights and supports agile decision-making. Continuous monitoring and refining of the analysis process is also essential for maximizing the effectiveness of data-driven decisions. Here are key steps for ongoing monitoring and refinement:
1. Conduct Regular Reviews: This step is very crucial. Make it a point to check your analytics dashboard daily and review the metrics. This will ensure, you have constant track of your numbers. Also, set up regular review cycles to assess the performance of your business. This could be done daily, weekly or on a timeline that aligns with your specific objectives and decision-making cycles.
2. Seek Feedback and Insights: Engage with stakeholders and teams involved in the decision-making process. Gather feedback on the outcomes and effectiveness of the decisions. Encourage open communication and foster a culture of continuous improvement. Incorporate feedback and insights into future analyses and decision-making to refine your approach.
3. Iterate and Optimize: Based on the insights gained through monitoring and reviewing, iterate and optimize your analysis process. Continuously refine your methodologies, data collection processes, visualization techniques, and decision-making frameworks.
Conclusion
In today’s data-driven world, analytics holds the key to unlocking new opportunities and driving organizational success. By leveraging data to make informed decisions, organizations can optimize operations, enhance customer experiences, and gain a competitive edge. By embracing analytics as a transformative tool, businesses can unleash their power to uncover valuable insights, fuel innovation, and achieve their goals in an ever-evolving landscape. So do not wait get started with business analytics.


