Categories
In the realm of business analytics, the ability to forecast and measure performance is paramount. Companies thrive on making informed decisions that propel growth and mitigate risks. This is where the concepts of leading and lagging indicators come into play. Understanding and effectively utilizing these indicators can be a game-changer for any business seeking to stay ahead of the competition and ensure long-term success.
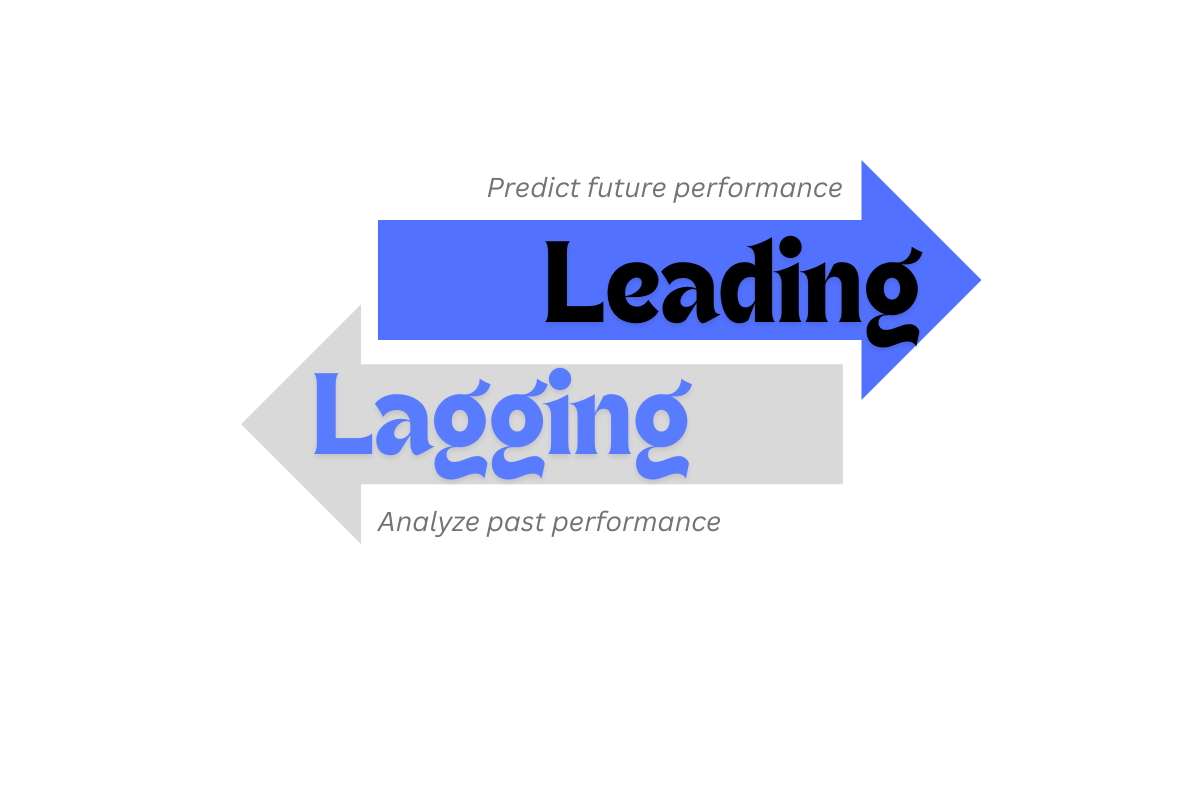
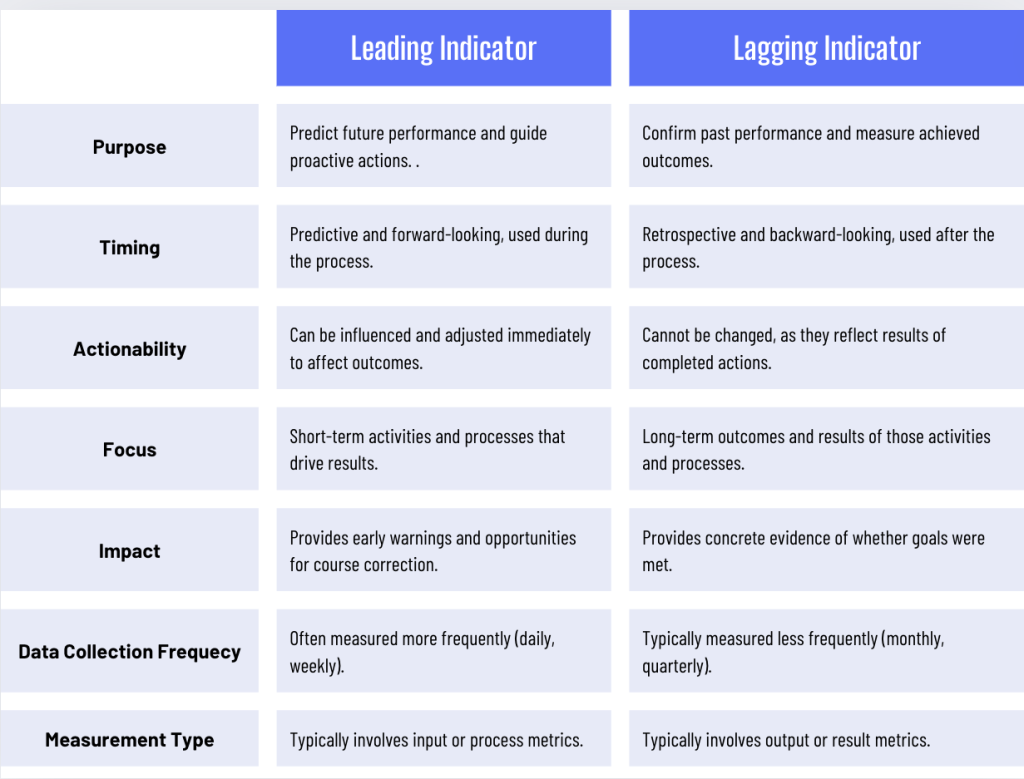
Leading indicators are predictive metrics that provide early signals about future performance. They are proactive and forward-looking, offering insights that can help businesses make adjustments before trends and outcomes fully develop. These indicators focus on activities and processes that influence future results, allowing organizations to anticipate changes and adapt accordingly.
Scenario: Launching a New Product with High Adoption Rate
Here’s an example where a company aims to launch a successful new product within nine months.
Goal: To achieve a 30% adoption rate of the new product within the first three months post-launch.
Leading Indicators: To ensure you’re on track for a successful product launch and achieve the desired adoption rate, focus on leading indicators that reflect product readiness, market interest, and pre-launch engagement.
Set Targets for Leading Indicators:
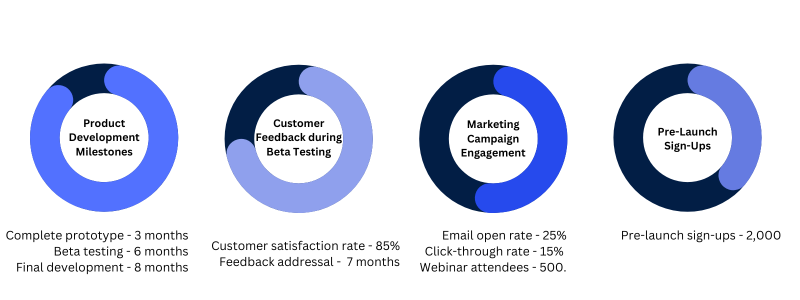
After the Leading Indicators are set Monitor and Analyze these Metrics by conducting monthly meetings to review product development progress and beta testing feedback. Also, bi-weekly assess marketing campaign engagement and pre-launch sign-ups to identify gaps or trends.
As needed Adjust Strategies to achieve the goals. If product milestones are delayed, allocate additional resources or adjust project timelines. Also, if beta feedback is negative, prioritize critical improvements and retest with a select group of users. If engagement metrics are low, refine marketing strategies, increase promotional activities, and explore new channels. High marketing engagement and pre-launch sign-ups indicated strong market interest and readiness for adoption.
By consistently tracking and analyzing these leading indicators, you can ensure that your team remains proactive and aligned with the overall goal of achieving a high adoption rate for the new product within the first three months post-launch. This approach allows for timely adjustments and sustained focus on activities that drive success.
Lagging indicators, on the other hand, are retrospective. They measure the outcomes and results of past actions and decisions. These indicators provide a clear picture of performance but do not offer predictive insights. While they are essential for evaluating success and identifying areas for improvement, they do not help in forecasting future performance.
Scenario: Evaluating the Success of a New Product Launch
Here’s an example where a company aims to evaluate the success of a new product launch by using lagging indicators.
Goal: The goal is to achieve a 30% adoption rate within the first three months post-launch.
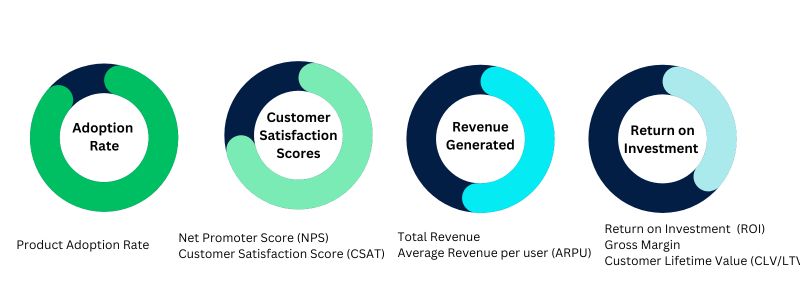
Leading Indicators: To measure the success of the product launch, focus on lagging indicators that reflect actual performance outcomes and customer reactions. Here are a few key metrics to consider:
Collect Data for Lagging Indicators:
Once you have tracked the numbers, Analyze Performance by conducting monthly reviews to analyze collected data and compare with targets. Identify trends and patterns in the data to understand the overall success of the launch.
Make Data-Driven Adjustments like Product feature enhancements based on customer feedback, to improve user experience and satisfaction. Optimize Marketing Strategies to address any gaps in reaching the target audience. Increase targeted marketing campaigns and promotional offers to boost adoption and revenue. Adjust Pricing if revenue targets are not met, consider adjusting pricing strategies to enhance sales. Introduce tiered pricing options to attract more customers and increase sales.
By focusing on these lagging indicators, you can evaluate the overall success of your product launch and identify areas for improvement. This approach allows you to make data-driven adjustments to enhance future performance and ensure long-term success.
Understanding the distinction between leading and lagging indicators is essential for effective performance management. While leading indicators help predict future outcomes and guide proactive actions, lagging indicators confirm past performance and measure the success of those actions. Together, they provide a comprehensive view of an organization’s progress and effectiveness.
Scenario: Sales Performance
Goal: Increase sales revenue by 20% over the next quarter.
Leading Indicators (Predictive and Actionable):
Lagging Indicators (Confirmatory and Result-Oriented):
The Relationship:
In conclusion, you are missing out on the full metric picture if you are using lagging indicators without leading indicators. The strategic integration of leading and lagging indicators is vital for effective performance management. Leading indicators offer early insights and guide proactive adjustments while lagging indicators validate the outcomes of those efforts. By leveraging both, organizations can navigate real-time challenges, ensure alignment with long-term goals, and continuously refine their strategies for sustained success. This balanced approach enhances decision-making and agility and provides a comprehensive understanding of overall performance, driving continuous improvement and growth.