
Categories
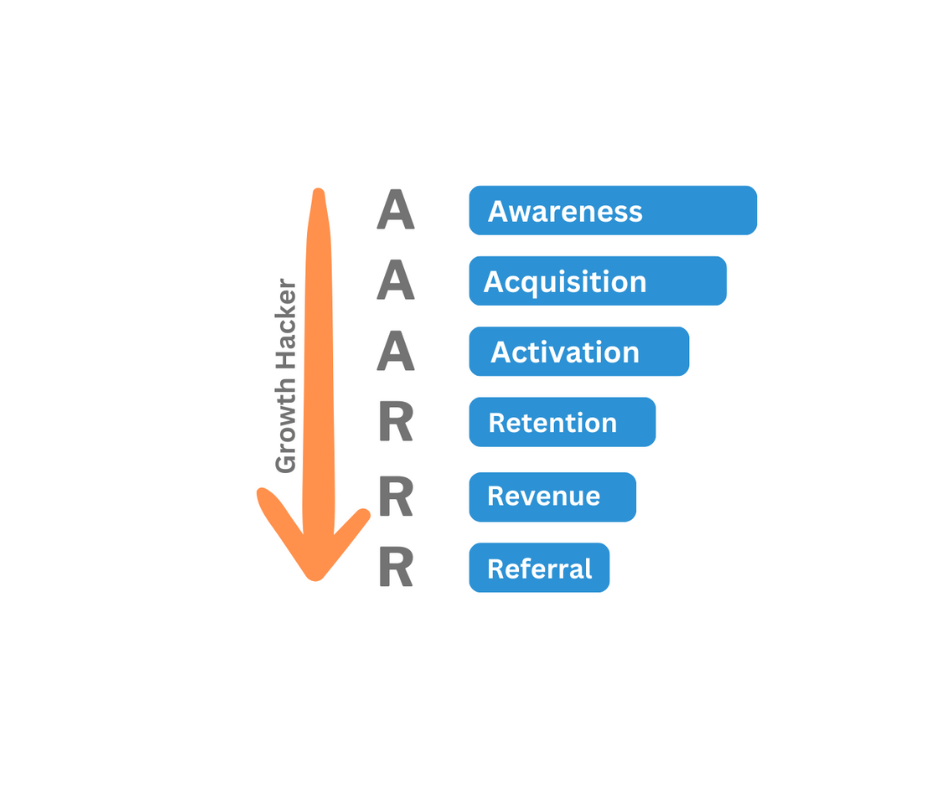
AARRR Metrics, also known as the Pirate Metrics or the AAARRR framework, is a model used to measure and analyze the performance of a business or product. The framework is designed to help track and optimize growth and user acquisition strategies. This model serves as the primary tool for nearly every growth hacker, helping them pinpoint bottlenecks and discover where the business is missing out on growth. It is an acronym for a set of six metrics that stands for each stage of the user journey that you should be tracking: Awareness, Acquisition, Activation, Retention, Referral, and Revenue.
Dave McClure, an experienced entrepreneur and investor in Silicon Valley and the founder of the Company ‘500 Startups’, observed that many startups were giving undue attention to vanity metrics like ‘Number of website visitors’, ‘Number of Social Media page likes’ etc; which were superficial indicators of success—rather than focusing on the essential aspects of sustainable growth.
Through the AARRR framework, McClure aimed to achieve two main objectives.
Vanity metrics often present a narrow view of the customer lifecycle. In contrast, AARRR metrics, — focus on every stage of the lifecycle to help you gain actionable insights into your consumers, identify bottlenecks, and create sustainable growth. Hence, the Pirate Funnel is used to find the weakest point of a business that needs focus.
The journey of optimizing business growth can be effectively captured through the AARRR framework, which dissects a company’s operations into six pivotal stages: Acquisition, Activation, Retention, Referral, and Revenue. As this framework matured, it evolved into the comprehensive AAARRR framework, seamlessly adding the Awareness step on top of the funnel. Thus forming the AAARRR framework that guides businesses to navigate the multifaceted landscape of growth.
Every customer need to progress through each of these stages, and this process aids in identifying bottlenecks and shortcomings within the business. Using the Pirate Funnel, you gain visibility into the specific segment of your funnel that’s negatively impacting your business. This insight empowers you to implement a series of measures to rectify the situation. With each enhancement you make to any part of your Pirate Funnel, you improve your ‘North Star Metric,’ thus fostering your long-term growth trajectory.
In the original Pirate Funnel devised by McClure, the Awareness step wasn’t initially integrated into the funnel. Originally, it adhered to the AARRR framework. Later the Awareness step was added to the framework making it AAARRR framework. The Marketing team owns the Awareness and Acquisition stages of the funnel whereas Activation, Revenue, Retention, and Referral are owned by the product team.
Awareness – How many people do you reach?
Acquisition – How many people are reaching your website?
Activation – Are these people taking the actions you want them to? (Eg: Signup, Install the app, etc)
Revenue – How many people start paying for the product?
Retention – How many activated users came back for repeat purchases?
Referral – Do users like the product enough to tell others about it?
Let’s go through the stages in detail:
The “Awareness” stage in the AAARRR framework focuses on making potential customers aware of your product or service. It’s about creating brand visibility and generating initial interest. So in this stage it’s about how many people you have reached with your marketing. Here are some popular key metrics to track in the “Awareness” step:
Remember that the specific metrics you track may depend on your industry, target audience, and marketing channels. The goal of tracking these metrics in the “Awareness” step is to gauge how effectively you’re creating initial interest and visibility for your brand or product.
In the “Acquisition” stage of the AAARRR framework, the emphasis is on determining how many people are reaching your website/application. It describes how people find a product/service or brand and eventually become customers. For this segment of the statistics, it is important to precisely observe website visitors and website data. How many visitors does the website get on a daily basis? In this stage you need to know two important things:
Here are some popular key metrics to track in the “Acquisition” step:
While some users may create accounts, they might not proceed to actively engage with your product. This is where the Activation stage comes into play, helping you identify whether the issue lies in getting users started or in maintaining their engagement over time.
Delving deep into activation metrics is essential. These metrics have the power to encapsulate that pivotal “aha” moment when users truly recognize the value your product brings to their lives. By pinpointing this moment of realization, you gain insights into what specific aspects of your product are resonating most strongly with users.
In essence, effective activation tracking is more than just a surface-level measurement—it’s a tool for dissecting the intricacies of user engagement, understanding the transition from initial curiosity to genuine value, and paving the way for sustained user retention and growth.
Here are some popular key metrics to track in the “Acquisition” step:
In the “Revenue” step of the AAARRR framework, the focus is on the conversion of activated users into paying customers and optimizing revenue generation. This stage is crucial for sustaining your business’s financial health. The specific revenue metrics you track will depend on your business model and industry. For instance:
These metrics, tailored to your business model, provide insights into the financial health of your business, the effectiveness of your monetization strategies, and the overall value that your user base brings to your revenue stream.
In the “Retention” step of the AAARRR framework, the focus is on keeping users engaged with your product over the long term. This stage is crucial for building a loyal user base and maximizing the value they derive from your offering. Retention is indeed among the most vital metrics for any business. Achieving success in both activation and retention is a strong indicator that your product holds significant value for your audience. It suggests that you’ve not only managed to effectively engage users right from the start but have also been successful in maintaining their interest and engagement over time. This combination reflects a positive user experience and a product that aligns well with your customers’ needs and preferences. Ultimately, the synergy between activation and retention plays a pivotal role in building a loyal customer base and driving sustainable growth for your business.
Here are key metrics to track in the “Retention” step:
These metrics offer insights into how effectively you’re retaining users, which features are resonating, and where improvements might be needed to sustain long-term engagement and loyalty.
In the “Referral” step of the AAARRR framework, the focus is on leveraging the power of your satisfied users to bring in new customers through word-of-mouth and advocacy. This stage involves metrics that measure the effectiveness of your referral and word-of-mouth strategies. Here are key metrics to track in the “Referral” step:
There’s perhaps no stronger validation for your product than when a user enthusiastically recommends it to their colleagues or friends. This act of advocacy signifies not only that users find value in what you’ve created, but also that they trust it enough to stake their reputation on the recommendation.
Indeed, this kind of word-of-mouth growth is incredibly potent. It spreads awareness organically and carries a level of credibility that traditional marketing often struggles to achieve.
Determine the nature of your product or service, your target audience, and the key actions that lead to success. Based on that identify and prioritize the stages that hold the most significance for your product’s growth. For instance, if user activation is crucial for providing value, prioritize that stage.
Creating a visualization of your customer journey is an excellent approach to ensure a comprehensive understanding of every step in the Pirate Funnel (AAARRR Framework). An example customer journey visualization is created below for a SaaS business:
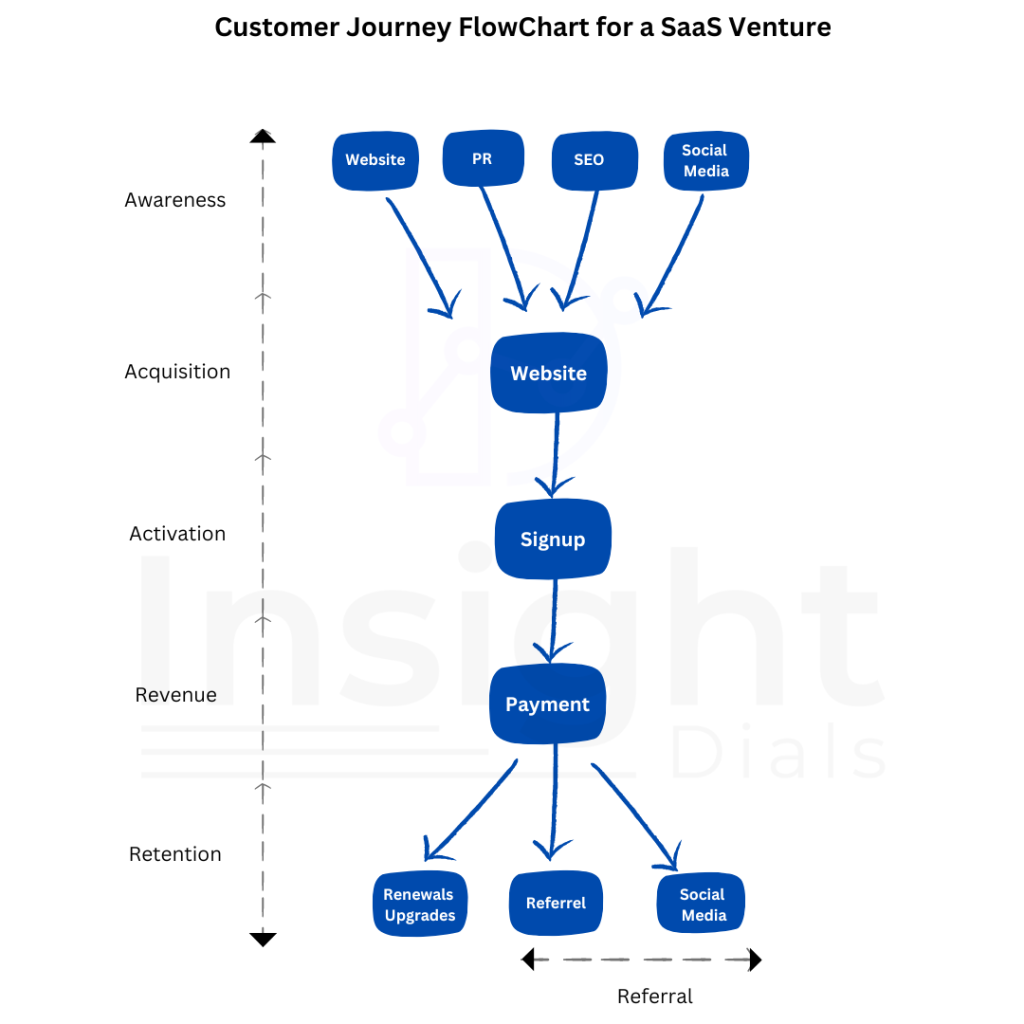
Align each stage of the AAARRR framework (Awareness, Acquisition, Activation, Retention, Referral, Revenue) to the specific actions your users take as they interact with your product. Define the metrics you’ll track for each stage. For example, in the Awareness stage, metrics could include website traffic, social media reach etc. This can be obtained from tools like Google Analytics, Adwords or Facebook Ads etc. If you’re stuck without precise figures, then go for ballpark estimates. If you have an intuitive sense of the numbers, go with that. But get started!
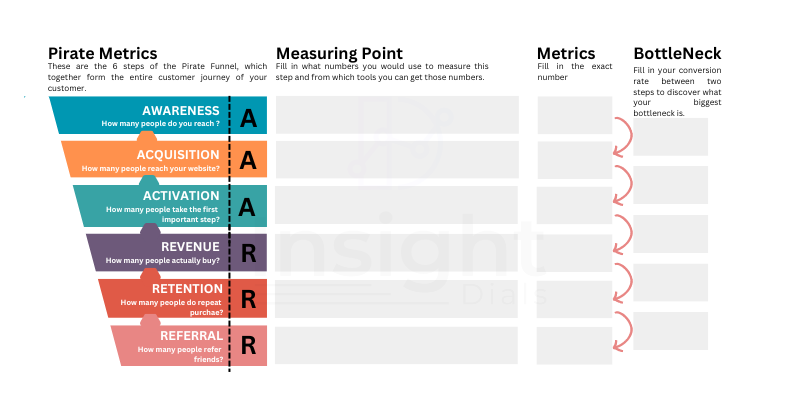
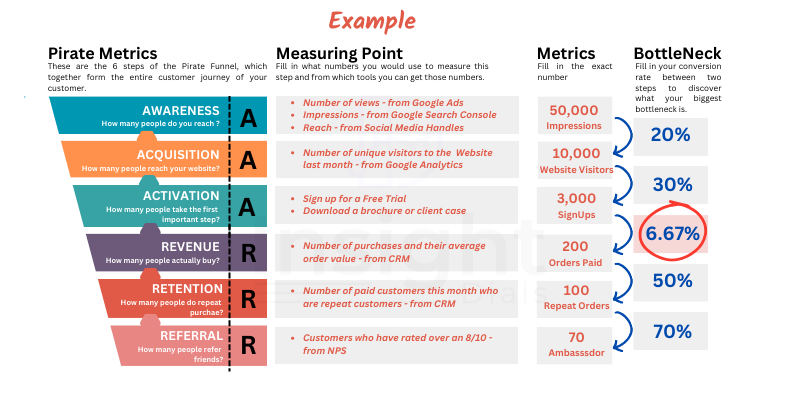
You can use a Pirate Metrics Canvas for guidance and structure. This tool can provide invaluable assistance in navigating the intricacies of the AARRR framework. A sample Pirate Metric Canvas is added below:
Identifying bottlenecks within the AAARRR funnel involves a systematic analysis of each stage to pinpoint where user progression stalls. Follow the below steps to identify your bottleneck.
Once you identify the bottleneck’s root cause, work on resolving the issues. It might involve improving user experience, simplifying processes, or providing better value.
Choose a ‘One Metric That Matters’(OMTM) that is closely aligned with the stage where the bottleneck has been identified. It should reflect the critical action or outcome that needs improvement. Use the OMTM as a guiding compass to address the bottleneck. Devote your resources, strategies, and efforts toward initiatives that directly impact the OMTM.
Ensure that your solutions don’t negatively impact other stages of the funnel or the overall customer experience. As you address the bottleneck and see improvements in the OMTM, keep an eye on other potential bottlenecks that might arise. Adapt your strategies accordingly and continue using the OMTM as a guide.
This ensures that you’re making focused and impactful changes to overcome bottlenecks and drive sustainable growth within the AAARRR framework.
After addressing the bottleneck, monitor how it affects the conversion rates and overall user progression. Continue to iterate and optimize based on data and user feedback.
As you resolve one bottleneck, new ones may emerge. Regularly repeat this process to ensure smooth user progression through the funnel.
Remember, the goal is to create a seamless flow from one stage to another, enhancing the user experience and driving growth.
In a world inundated with data and metrics, the AAARRR framework guides businesses to focus on the metrics that truly matter, steering them away from vanity metrics and toward actionable insights. From startups to established enterprises, this methodology provides a clear roadmap to analyze, strategize, and iterate, ultimately enhancing the user experience and driving sustainable growth.
However, the true strength of the AAARRR framework lies not only in its structure but in its adaptability. Each business can tailor this framework to its unique product, audience, and goals. The process of identifying bottlenecks, optimizing user pathways, and continuously refining strategies emphasizes a commitment to progress over perfection.