In today’s technology-driven world, maintaining the performance and health of your application is very important. Here for this case study, I am taking the MySQL Service to test the Grafana and Prometheus monitoring. In today’s world, most applications use Mysql DB; and MySQL databases are paramount for ensuring the smooth operation of your applications. To achieve this, you need effective monitoring tools that provide insights into your database’s performance metrics. Grafana and Prometheus are two such tools that when combined, can offer a powerful solution for monitoring MySQL databases.

In this article, we will guide you through the process of setting up Grafana and Prometheus to monitor MySQL performance effectively.

Why Monitor MySQL Performance?

Before we dive into the setup process, let’s understand why monitoring MySQL performance is essential:

  • Performance Optimization: Monitoring helps identify bottlenecks, slow queries, and other issues that can hinder database performance. This information is crucial for optimizing your MySQL setup.
  • Proactive Issue Detection: By tracking metrics in real-time, you can catch potential problems before they escalate into critical issues, reducing downtime and data loss.
  • Resource Allocation: Monitoring data can help you allocate server resources efficiently. You can scale resources up or down based on actual usage patterns, saving costs and improving performance.
  • Trend Analysis: Historical data and trends can assist in capacity planning and predicting when you may need to upgrade your infrastructure.

Prerequisites

Before getting started, ensure you have the following components set:

Setting Up Prometheus

Prometheus is an open-source monitoring and alerting toolkit. It scrapes metrics from various targets, stores them, and makes them available for querying and visualization. Here’s how you can set up Prometheus for MySQL monitoring:

  • Download and Install Prometheus: Download the latest version of Prometheus from the official website and follow the installation instructions.

OR

Refer to the following “How to Install Prometheus if you have not done it already? – https://prometheus.io/docs/introduction/first_steps/

  • Configure Prometheus: Create a prometheus.yml configuration file and define MySQL as a target. Here’s an example snippet:

yaml

global:

scrape_interval: 15s

scrape_configs:

job_name: ‘mysql’

static_configs:

 targets: [‘mysql_server_ip:9104’]

PS: Replace ‘mysql_server_ip’ with the IP address of your MySQL server.

  • Start Prometheus: Launch Prometheus with the following command:

./prometheus –config.file=prometheus.yml

Prometheus should now be running and collecting metrics from your MySQL database.

Setting Up Grafana

Grafana is a popular open-source platform for monitoring and observability. It allows you to create customizable dashboards to visualize the data collected by Prometheus.

  • Download and Install Grafana: Download and install Grafana by following the installation instructions provided on the official Grafana website. Reference: https://grafana.com/docs/grafana/latest/setup-grafana/installation/debian/
  • Access Grafana Web UI: Open a web browser and access Grafana’s web UI (usually at http://localhost:3000). Log in with the default username and password (admin/admin) and change the password when prompted.
  • Add Prometheus Data Source: Go to “Configuration” > “Data Sources” > “Add data source.” Choose Prometheus as the data source type and configure it with the URL to your Prometheus server (e.g., http://localhost:9090).
  • Create Dashboards: Now, it’s time to create custom dashboards to monitor MySQL performance. You can either design your own dashboards or import pre-built MySQL dashboards available in the Grafana community.
  • Visualize and Set Alerts: Customize your dashboards to display MySQL metrics like query performance, connections, and resource usage. Set up alerts to be notified of any unusual behavior.

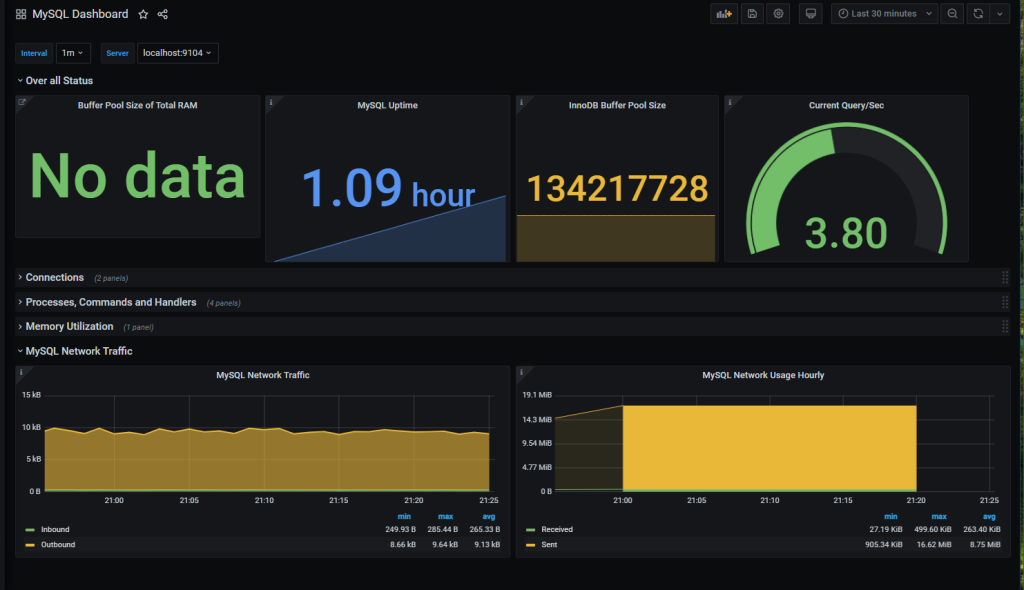
Sample Mysql Built Dashboard in Grafana:

Grafana and Prometheus for Monitoring
PC: https://grafana.com/grafana/dashboards/14031-mysql-dashboard/

Conclusion

Monitoring MySQL performance with Grafana and Prometheus is a powerful way to ensure your database is running optimally. By following the steps outlined in this article, you can collect, visualize, and analyze essential metrics, enabling you to make informed decisions about your MySQL infrastructure. Regularly monitoring your MySQL database can help you maintain a stable and high-performing application ecosystem while proactively addressing any issues that may arise.

Business Analytics tool for Small and Medium businesses

By Cherry

Systems Engineer, InsightDials

error: Content is protected !!