Monitoring the health, performance, and availability of an application is critical for ensuring a seamless user experience and identifying potential issues proactively. With the vast array of services and resources provided by Amazon Web Services (AWS), developers and operations teams can leverage AWS CloudWatch to gain valuable insights and effectively monitor their applications. While AWS CloudWatch is commonly recognized for its metrics, alarms, and logs. It provides a comprehensive suite of capabilities that enable customers to achieve in-depth visibility into their systems, ensuring the optimal health of their applications. This article will explore how application monitoring with AWS CloudWatch can help provide real-time metrics, logs, alarms, and automated actions for enhanced observability.
What is AWS CloudWatch?
AWS CloudWatch is a fully managed monitoring and observability service provided by Amazon Web Services (AWS). It offers a comprehensive suite of tools and services that enables teams to monitor their applications, infrastructure, and services on the AWS platform. CloudWatch collects and tracks metrics, aggregates and analyzes log files, sets alarms, and provides a centralized dashboard for visualizing and managing all monitoring data.
CloudWatch serves as an essential repository for storing time series data of AWS metrics. It takes raw data feeds from various AWS services and transforms them into actionable information. With CloudWatch, you can access a range of predefined variables at no additional cost. These variables are readily available for graphing and setting up alerts. This allows you to keep a close eye on the performance of your resources.
Expanded Monitoring Capabilities:
CloudWatch offers a paid service that extends the monitoring capabilities beyond the predefined metrics. With the paid version, you gain access to a broader range of metrics. Which includes the ability to define and monitor your own custom metrics. This gives you unparalleled flexibility in monitoring the specific aspects of your AWS resources that matter most to your business. You can access, graph, and set up alerts for these metrics through the CloudWatch console, command line interface, or API
Key Features of AWS CloudWatch for Application Monitoring
Comprehensive Metrics Monitoring:
AWS CloudWatch offers a centralized platform to collect, store, and visualize metrics from various AWS services and resources. With CloudWatch Metrics, developers can monitor critical indicators like CPU utilization, memory usage, network traffic, and database performance. By leveraging pre-defined metrics or customizing their own, teams can gain granular visibility into their application’s performance and resource utilization.
Real-time Log Monitoring and Analysis:
CloudWatch Logs empowers developers to collect, monitor, and analyze logs from applications and AWS resources in real-time. It allows for centralized log management, enabling teams to troubleshoot issues efficiently. By streaming logs directly to CloudWatch Logs or utilizing agents and SDKs, developers can gain insights into application behavior, detect anomalies, and identify potential errors or bottlenecks impacting performance.
Proactive Alerts with CloudWatch Alarms:
CloudWatch Alarms provide a mechanism to set up customized thresholds for metrics monitoring. When metrics breach these thresholds, alarms trigger notifications through various channels, including email, SMS, or AWS Simple Notification Service (SNS). By configuring alarms for critical metrics like response time or error rates, teams can receive real-time alerts and promptly respond to potential issues before they impact end-users.
Centralized Monitoring and Visualization with Dashboards:
CloudWatch Dashboards enable the creation of customized visualizations to monitor key performance indicators, metrics, logs, and alarms in a centralized location. With easy-to-use widgets and charts, teams can gain a comprehensive view of their application’s health, performance trends, and potential issues. Dashboards can be shared across teams, fostering collaboration and facilitating quicker decision-making.
Integration and Automation:
CloudWatch seamlessly integrates with other AWS services, enabling you to automate actions based on events or alarms. You can; Scale resources dynamically based on workload demands; Trigger AWS Lambda functions for custom actions; Perform remediation actions automatically in response to specific events, all driven by CloudWatch metrics and events. CloudWatch’s integration and automation features empower you to optimize resource utilization, automate operational tasks, and ensure efficient application management.
Use case of Configuring CloudWatch to Monitor Low CPU Utilization and Send Notifications
Configure Amazon CloudWatch to send a notification when CPU Utilization of an instance goes more than 85%
Step 1 : Create a CloudWatch Alarm:
- Open the CloudWatch Management Console.
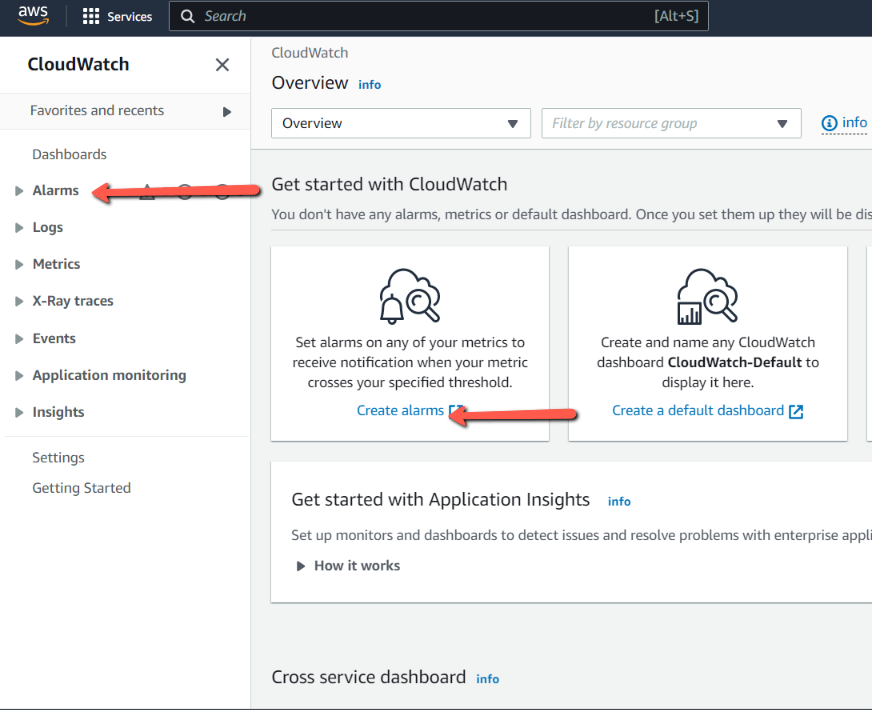
- In the navigation pane, click on “Alarms” and click on the “Create Alarm” button.
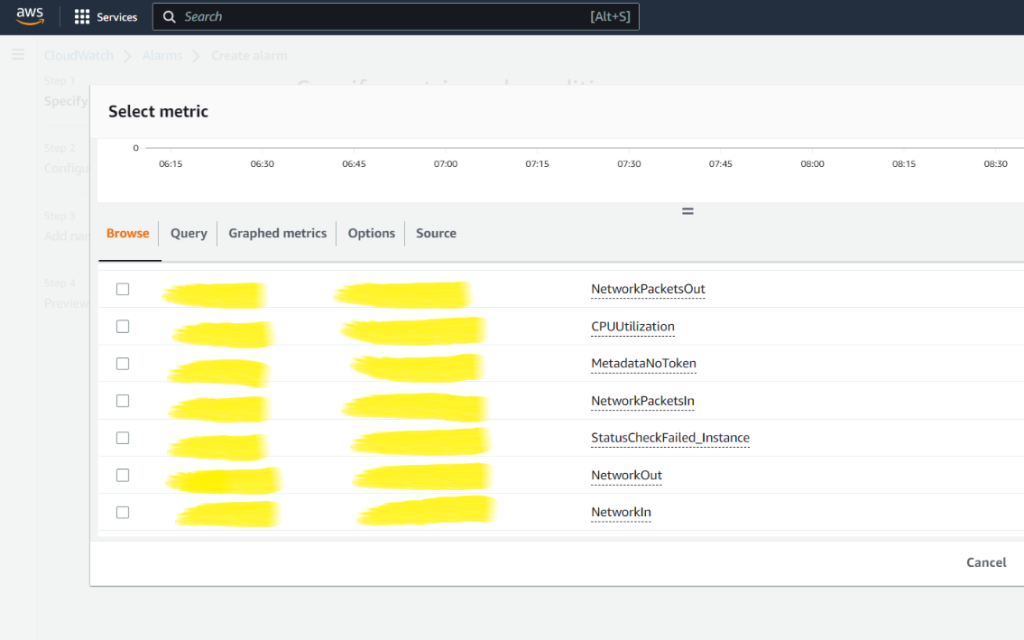
- Now select the EC2 metric “CPUUtilization” for the specific instance you want to monitor.
- On the Specify Metric & Conditions Step, configure the “Period” to match the granularity of your detailed monitoring (usually 1 minute).
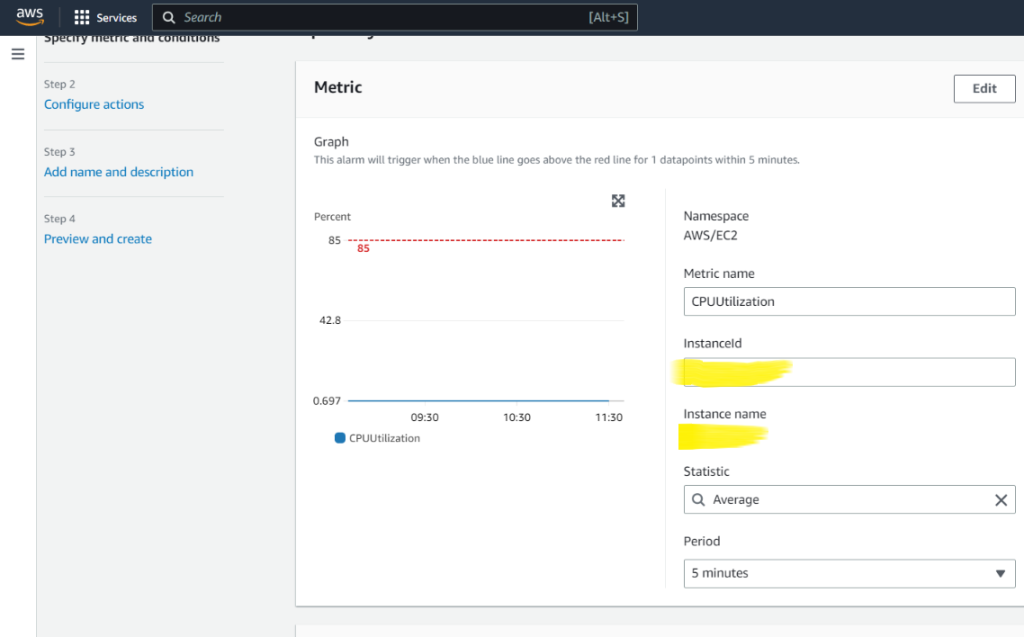
- Under Conditions, create an alarm to notify when CPU Utilization metric of the instance is over 85%
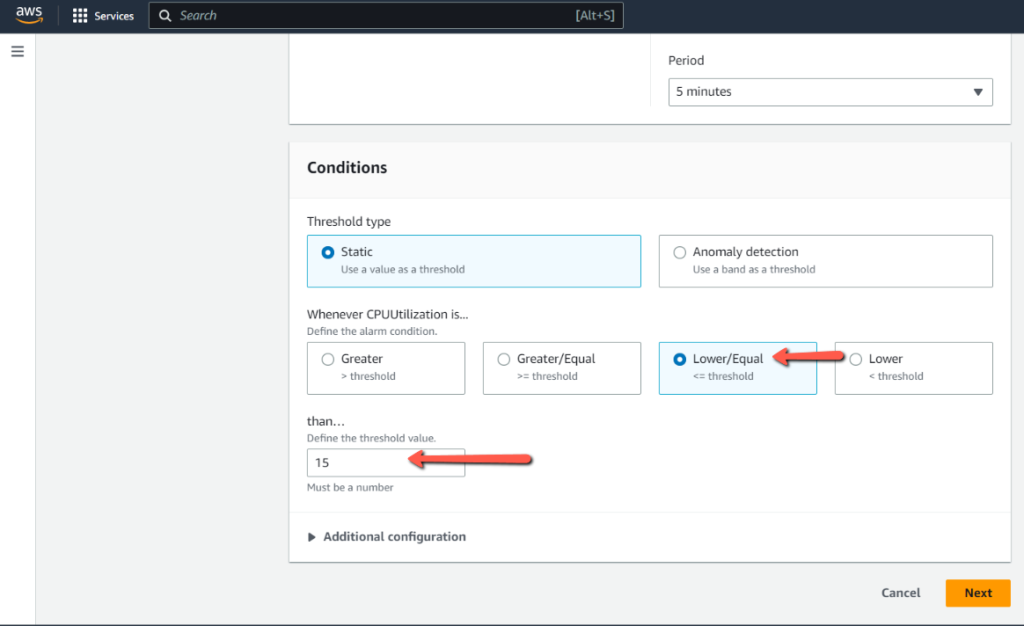
- Under Additional Configuration, if required, specify the number of consecutive periods the CPU utilization must be below the threshold to trigger the alarm.
- Finally, set up an action for the alarm, such as sending a notification to an email address or an Amazon SNS topic.
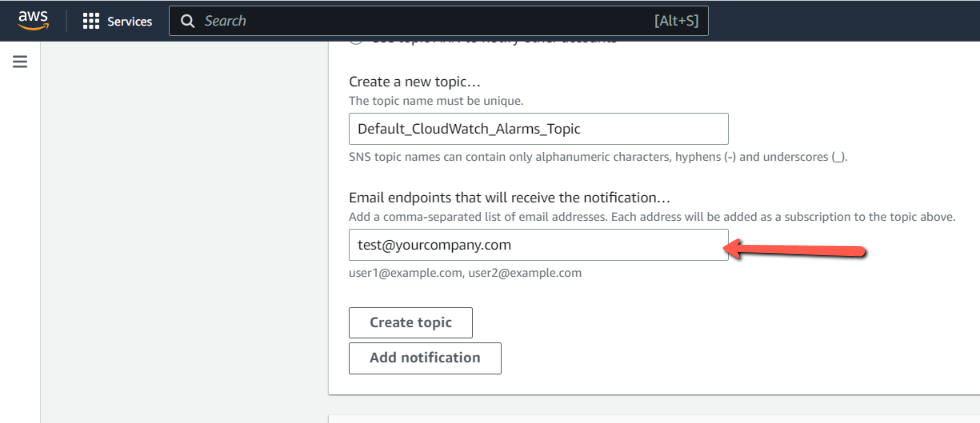
- Review the alarm settings and click “Create Alarm” to complete the configuration.
Conclusion:
AWS CloudWatch offers a robust suite of monitoring and observability services to enhance application monitoring on the AWS platform. By leveraging CloudWatch Metrics, Logs, Alarms, and other features, developers and operations teams can gain real-time insights, proactively identify issues, and optimize the performance and availability of their applications. With CloudWatch’s comprehensive monitoring capabilities, organizations can deliver exceptional user experiences, improve operational efficiency, and achieve their business objectives effectively.


