What is Business Intelligence? We are familiar with the terms data, analytics, business intelligence, data visualization, KPI, metrics, insights, etc. But, are they just random terms, or are you using them for your business growth? Are you fully exploiting the data that your business is generating?
More than 80% of the data generated by most businesses are going wasted. All businesses are collecting data on their clients, billing, sales, operations, and many other areas. But, the problem is they do not know what to do with this data. This data, if not analyzed properly is fully wasted. While, if it is used properly it can help in drastically improving many areas of your business.
But why are businesses not analyzing their data?
There are multiple reasons for that. The lack of awareness about analytics and ignorance of the benefits it brings to the growth of the business is a factor. Another major factor is the time businesses need to set apart for analytics. Founders get too occupied with the day-to-day tasks of the business and often miss out on analytics. The complexity involved in analytics is another reason. The complex calculation and the complicated data modelers required to obtain the metrics often give the notion that data analytics has to be done by a data scientist. Adding to that, scattered data across multiple day-to-day tools also make analytics tough. However, not knowing what all metrics to track is a crippling factor that stops small organizations from embracing analytics.
So, the reasons for organizations not embracing analytics are:
- The lack of a data-driven culture
- Not knowing what metrics/KPIs to track
- Scattered data across multiple tools
- Lack of time for analytics
- Complexity of analytics
- The notion that a data scientist is required for analytics
All this can be solved by adopting the right analytics tools. There are several tools available in the market that can be integrated with your applications to bring all the scattered metrics to a central location. These tools also list the key metrics and help in visualizing these metrics on simple intuitive graphs, which can be interpreted by any non-technical person. Thus the right tools will make analytics simple, easy, and pain-free.
How can analytics help a business to succeed?
Tracking the right KPIs/metrics is essential for understanding the overall health of your business. It is seen that businesses that track and monitor their key metrics are double likely to hit their growth targets.
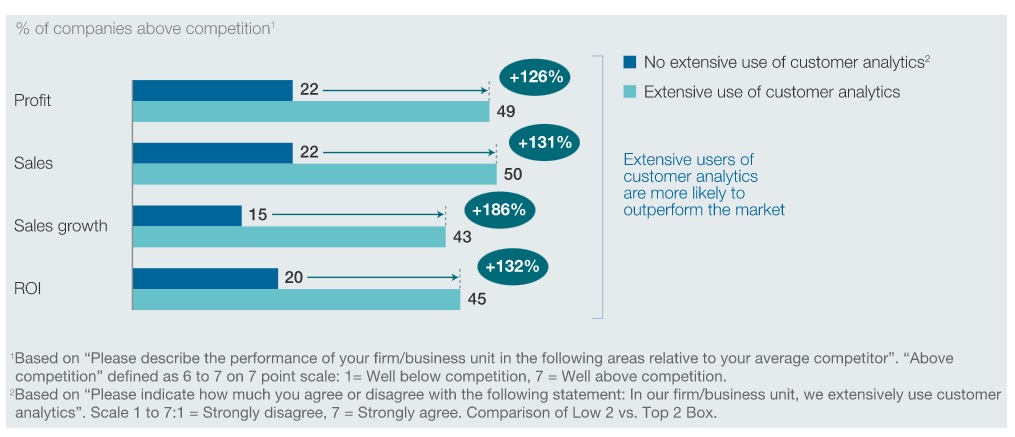
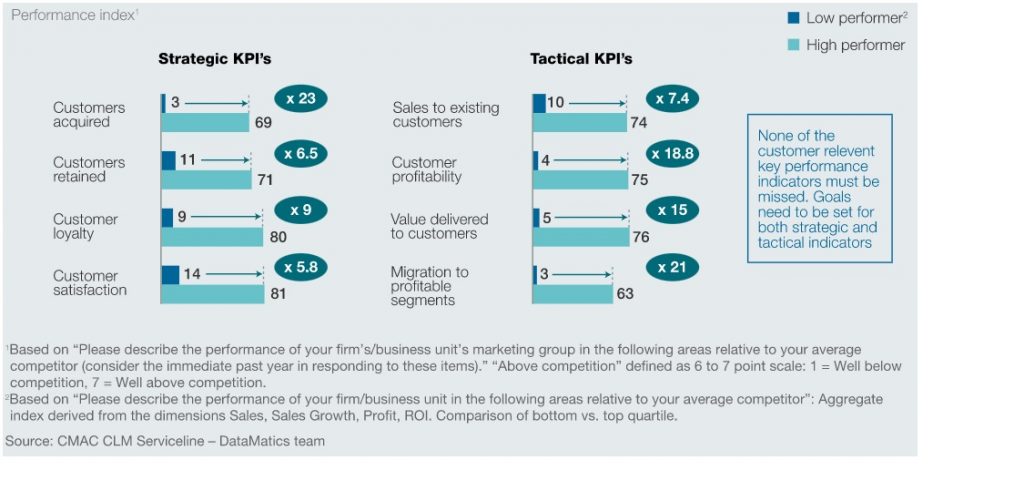
In research conducted by Mckinsey, businesses that leverage analytics are :
126% more profitable
131% higher sales
23 times more likely to attract customers
6.5 times more likely to retain the customers


So, what do these businesses do differently? They have leadership that understands the importance of analytics and takes strategic decisions based on the insights from their data. How the leadership or rather the CEO relies on data sends a strong message down to his team, to the rest of the organization. Thus these data champions encourage a data culture throughout the organization. This enables all to take mature well-informed decisions based on data and not on intuitions or experience.
The first step that can be taken in this direction, is to impart a data culture within the organization. Conduct educational workshops for the team, and educate them on the benefits of being data-driven. Identify key metrics or NorthStar metrics for the business. Track and monitor these metrics on a good data visualization dashboard; with every decision maker having access to their relevant metrics.
Make it a point to start every meeting by first reviewing the dashboard and analyzing the metrics. Identifying where the leak is, what went wrong, what could be done better, and deciding what corrective and preventive measure needs to be taken. The beauty of this practice is that it will induce a data culture in the team. It ensures that data is not just tracked but is effectively used to influence your strategic business decisions.
Turn Data into Insights and Actions
As data awareness and evolutions of BI tools are happening at a faster rate, more and more businesses are leveraging such tools and beating their competition, while proactively addressing customer needs. In the below example you will read how a small SFO start-up became a successful global company. How business Intelligence and data analytics helped them in that path.
Uber started off small. But they relied on the data generated by their business to grow their business further. This gave them faster growth in a shorter span. Uber collected all possible valuable data from their customers as well as from the drivers. Not just the standard or common metrics but also metrics like customer’s waiting times, peak demand hours, traffic for each city, a driver’s speed during a trip, and much much more. They used this data effectively to ensure that all their riders were offered with the best service, availability and pricing. As well as their drivers also got the best fares.
One of the most interesting applications of data is Uber’s surge pricing. While booking an Uber ride during a busy time like morning office hours or evening office-return time i.e peak traffic hours, or during rainy weather, the fares would be higher than the normal fares. This is known as Surge pricing. Where the fares go high with higher demand.
So how does it work?
Uber’s algorithm detects situations of high demand and low-supply and fixes the hike in price based on the demand-supply ratio without impacting the user’s experience. This is achieved using predictive analytics. Here based on patterns and trends in traffic, weather conditions, and demand-supply the surge charge is applied. To bring down the higher surge cost, uber has been directing the drivers to these higher-demand areas, thereby ensuring the availability of their service equally in all areas.
These benefits are not just for larger organizations alone. Any sized business, big or small can make effective use of data to identify bottlenecks, enhance their services and improve growth. Uber used the power of data from its early days to bring in the customer as well as driver delight and that was one of the key reasons for its success. They leveraged the power of data to get insights and turned these insights into actions, thereby bringing in higher customer satisfaction levels. So turn data into insights and actions.
Conclusion
All the above stats clearly show that the data-savvy companies outperform the ones who do not track their data/metrics. Hence to be truly data-driven, first, the senior leadership should be data-driven and encourage a data-driven culture across the organization. Only when more people in the organization have easy access to their relevant data will the organization as a whole move towards a data democracy. Once the organization starts moving in this direction, benefits like improvement in product, better client relationships, and smart growth can be witnessed. This will shape the future of your business and give you an edge over your competitors. However, collecting data and not processing it will not lead to the desired results.
This journey will be easier if traveling with the right BI tool, which will fully automate your BI process; reduce the time and effort required, reduce all complexity of analytics, easy access to data for all departments, and also no errors due to zero human intervention. This is where tools like InsightDials, which is built to fully automate your business intelligence and provide you with real-time analytics at your fingertip. Thus help you to turn data into insights and actions. Try our free beta.

