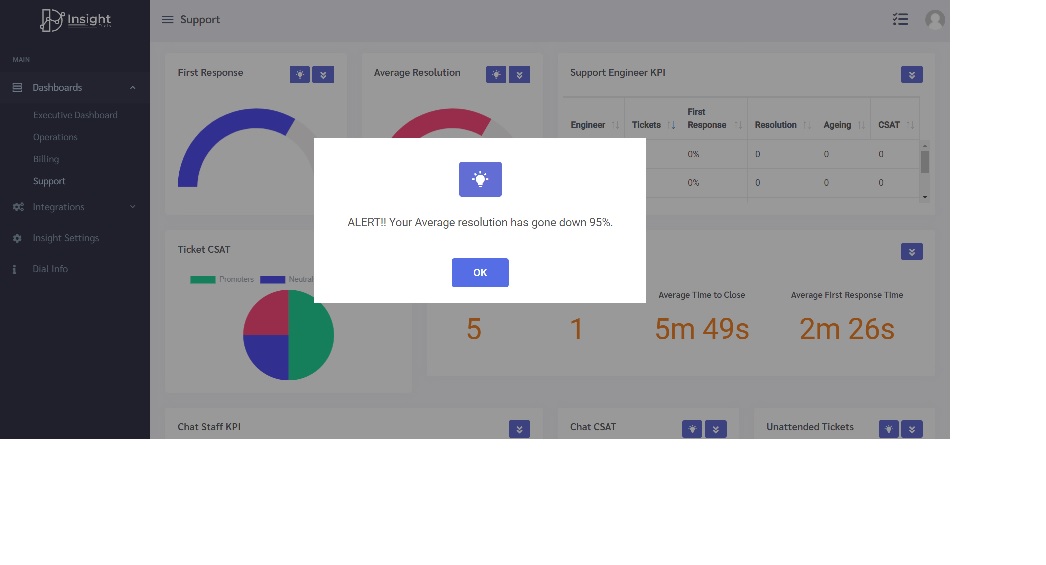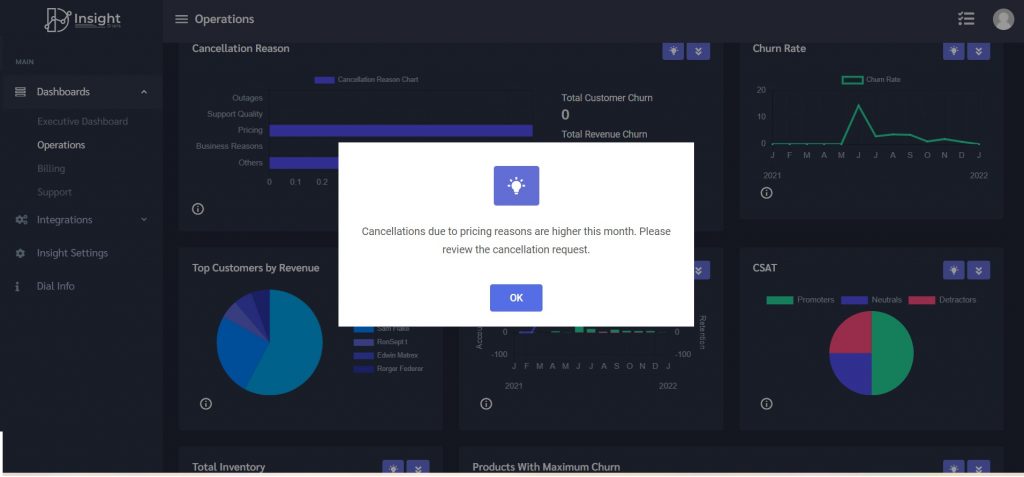
Insights are the findings or conclusions of analyzing data. Actionable Insights are those Insights that give clear direction on the actions that need to be taken based on the analysis.
Insights can be achieved by identifying interesting patterns, trends that vary from the normal or huge deviation from targets. Identifying the causes that led to these anomalies and recommending corrective or preventive measures are insights that call for an action.
Actionable Insights for Metrics
Customer life time value(LTV) metrics, represents the total amount of money a customer is expected to spend in your business during their lifetime, before they churn. This metrics helps to plan the ideal limit of your customer acquisition cost (CAC). Suppose your data shows a downward trend for LTV that’s below the CAC metrics; it clearly indicates that the business is making a loss. You need to either bring down CAC (marketing, discounts etc.); or increase the Revenue from customers; or work on customer retention and bring down the customer churn. The insights obtained from analyzing these metrics will clearly throw light on where exactly the leaks is. Also, shows what action needs to be taken to fix the downward trend.
Similarly for the monthly Revenue; if it shows a downward trend, there could be various reasons. It could be dip in the number of new customers who are onboarded; or it could be an increase in the customer churn; or an increase in the ageing accounts receivables (AR). The right insights will clearly specify the right reasons for the downward trend in monthly Revenue. Accordingly, the Sales, Ops or the Billing teams can then take corrective measures.
Thus, the right metrics with the right insights will help in taking the right decisions all the time.
InsightDials Insights Feature

InsightDials, come with actionable insights for all metrics, listing out patterns, anomalies and other deviation from targets. We also show metrics trends and metrics that have to be monitored. Our insights can be marked to take action and shared with team.
This multi-dimensional insightful analysis of data through simple, easy to interpret pre-designed dashboard graphs, meaningful insights, coupled with the macro level of data through drill-down, helps you to understand your data story and makes analytics fun and easy.
Every data has a story to tell. If you are not able to get insight from data to take strategic decisions then you are not reading the story your data is telling and this could lead to business errors.

