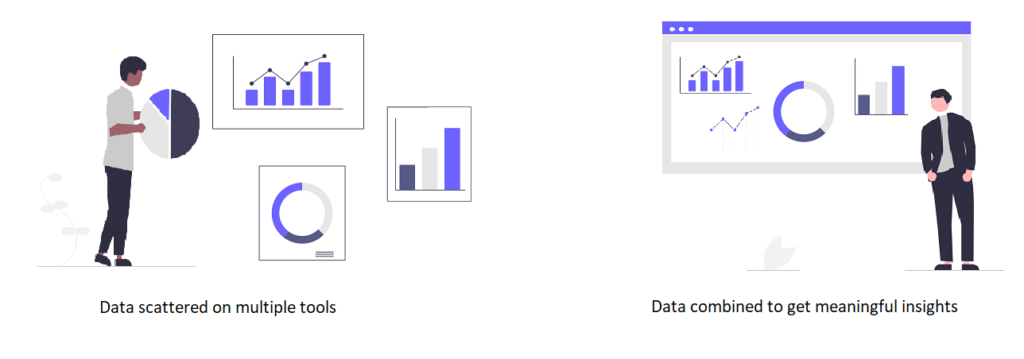
An All-in-one Business Dashboard helps in monitoring the holistic vitals of your organization on a single platform. Regardless of the different applications you use for sales, finance, support, chat etc., you can identify trends, track KPIs, correlate insights all on a single dashboard.
What is an All-in-one Dashboard?

Suppose your subscription-based company uses tools similar to QuickBooks/WHMCS for billing & support, Google analytics for marketing and Tawk.to for live chat. Though each of these tools have their own reporting, it limits you from correlating all these data together for analysis. With an all-in-one dashboard, you can bring together all this data from these different applications to a single platform, to monitor and analyze all your business-critical metrics with ease at a single glance.
Benefits of using an All-in-one Business Dashboard
- All your Business metrics at a single place
With an all-in-one business dashboard, you can stop juggling between multiple applications and reports. A centralized location for all your vital metrics. A single glance from any device at any time gives you the current state of your business, through visually pleasing and simple graphical representation of your key metrics.
- Ease of use with Prebuild Dashboards
These automated dashboards, which are prebuild, can be interpreted with ease. You would not need a data scientist or an expert to create the visual summary or decrypt the insights. These dashboards are pre-build and users can interact with them to get data at any point in time. This aids the non-technical to take intelligent business decisions without any tedious data analysis.
- Tracking only metrics that matter
Since these dashboards are crafted with the most important metrics from each of the applications, they will only have the vital metrics that matter for your business. These handpicked metrics avoids clutter and the pain of digging through the dashboard to get the vital numbers.
- Time Saver
Since these dashboards are automated, it saves time and effort involved in compiling the data from different sources. Slicing and dicing it to correlate KPIs to take important business decisions.


