
Categories
Reporting on applications refers to the ability of the application to generate and display data or information in a structured format, such as a report or a dashboard. This can include data visualization, data analysis, and data export capabilities. This data can be used to track and analyze key performance indicators, such as sales, user engagement, or resource usage. It can be used to make well-informed decisions. Reports can be customized to include specific data sets, filtering, and visualization options, and can be exported in various formats for further analysis or sharing. The type of reports and the level of customization available will depend on the specific tool being used.
In WHMCS, the Reports help you to view and export various data related to your web hosting business such as sales, invoices, transactions, and client activity. WHMCS provides a variety of built-in reports that can be accessed from the Reports section of the admin area. These reports can be customized to show specific data, and can be exported in various formats such as PDF, CSV, and Excel.
In general, the reporting capabilities of WHMCS are designed to provide you with detailed insights into your business operations, allowing you to track sales, customer activity, and financial data, and make informed decisions based on this information. If your business is relatively simple and you only need basic reporting and analytics, then WHMCS’s built-in analytics features may be sufficient. However, if you need to track all your key business metrics and get more advanced data visualization, then you may need to supplement WHMCS with additional analytics tools or services. Also, the level of detail and customization available with these applications’ built-in visualization tools may be limited. Additionally, the built-in visualization tools may not be as powerful or flexible as other data visualization tools that are specialised in this space.
WHMCS provides a variety of built-in reports that can be accessed from the Reports menu in the admin area. To access reports on WHMCS, you will need to log in to the WHMCS admin area. Once logged in, you can access the Reports section by clicking on the “Reports” link in the navigation menu. Usually located on the left side of the screen. From there, you will be presented with a list of available reports you can generate. You can also customize the time period for which you want to view the report, as well as select the appropriate filters and settings. You can also access reports by clicking on the Reports tab. From there you can select the report you want to generate.
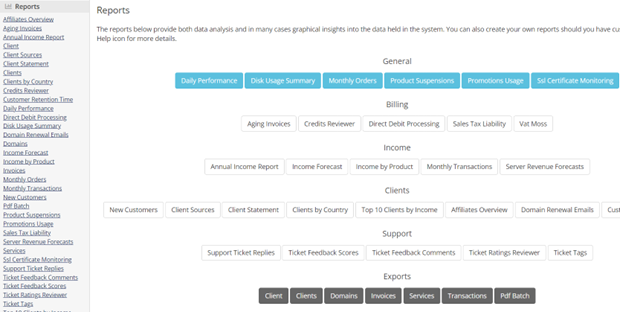
Here are a few examples of key reports that are available by default in the latest version of WHMCS:
Suppose you need to retrieve information on transactions for a specific time period. In that case, the WHMCS transaction report can provide a wealth of information. Including the amount received, the amount paid out, refunds, and other relevant details.
WHMCS comes with a variety of useful reports by default, sometimes your might need something different. Whether you need a very specific set of information, or simply more of the same report, WHMCS makes it easy to customize your data reporting.
For example, one of the default reports in WHMCS is the Top 10 Clients by Income report. This report is great for identifying your most important customers, but what if you want to expand on this list? With just a few simple steps, you can create a Top 25 Clients by Income report.
WHMCS reports are shipped unencoded, which means that you can easily duplicate and edit them. To get started, all you need to do is find the report file in the /modules/reports/ directory of your WHMCS installation. From there, you can make any necessary changes and start using your new report.
Customizing your data reporting can be a big help in understanding your customers better and making more informed business decisions. With WHMCS, you can make customisations to your reports with some PHP and SQL knowledge. Once you’re comfortable making small customizations, you can start customising the reports with bigger changes.
The standard reporting found in many applications often only provides a broad overview of metrics. Lacking the in-depth insights crucial for informed decision-making. As well as some form of processing is required to get your metrics from this raw data. To address this, it’s essential to leverage business intelligence tools that offer detailed and informative visualizations and analysis. These tools present metrics in the form of charts and graphs, allowing for easy identification of trends and patterns at a glance. Additionally, they provide advanced features such as drill-down functionality for deeper data exploration and the ability to search, filter and sort data by specific date ranges. This gives users a comprehensive, multi-dimensional view of their metrics. Above all, a simple and intuitively designed dashboard is vital for effectively uncovering the insights hidden within the data.
So, if your hosting business requires more advanced or custom visualizations, you may need to supplement WHMCS with additional visualization tools like Tableau, Power BI etc. They offer more advanced visualization features and customization options. But that would require expertise in those tools. Another option is to try out no-code business intelligence tools. That would not require manual effort but would help get in-depth business intelligence and data visualization automatically with ease.
It’s also important to note that having a good, detailed visualization tool is not enough. You need to have a clear understanding of your data. Have well-defined business goals and relate your business to your data to achieve these goals.